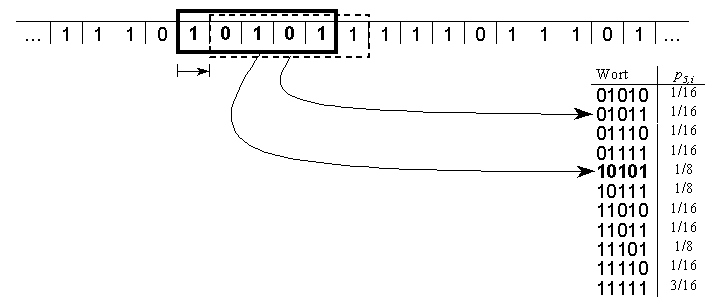
In the figure, you see a binary symbol sequence. A window of length 5 is sliding over the sequence, each time shifted by one symbol. Thereby, a list of all occuring words with their relative frequencies is created.
This article has been extracted from the author's thesis. It gives a brief overview on the calculation of some measures of information and complexity from a practical point of view. Please refer to the literature as e. g. listed in the thesis for further details and theoretical backgrounds.
The calculation of information and complexity is restricted to one-dimensional equidistant time series, here. The value range of a time series is restricted to the symbols of a small alphabet. Thus, we are talking about symbol sequences instead of time series. Examples of alphabets are:
If a time series is not a symbol sequence, then it can be transformed into a symbol sequence by e. g. partitioning the value range. Then, certain subranges of the value range can be mapped to certain symbols. A prefered partition is e. g. the mapping of all values below the median of the time series to symbol '0' and all values above to symbol '1'. Thus, a binary symbol sequence reveals with about an equal number of zeros and ones.
The calculation of information and complexity bases on distributions of subsequences of the symbol sequence – the so-called words. At first, you have to commit to a word length L. The words of length L are denoted as L-words. Now, determine the relative frequency pL,i of each of the occuring L-words. Some measures require transition frequencies between words in addition.

In the figure, you see a binary symbol sequence.
A window of length 5 is sliding over the sequence, each time shifted by one
symbol. Thereby, a list of all occuring words with their relative
frequencies is created.
Note: The measure of information and complexity are defined on probability distributions. But these are unknown for practical data like e. g. measurement data, texts, DNA, etc.. In that case, the probabilities have to be approximated by relative frequencies while calculating the measures. Be aware that we do not distinguish between relative frequencies and probabilities in the notation of this article.
The following terms and symbols are used in the formula below:
| L | word length |
| i | index of the i-th L-word, L-word i |
| λ | number of symbols in alphabet, alphabet size |
| n | number of different L-words, maximum λL |
| pi, pL,i | probability of occurence for i-th L-word |
| pL,ij | probability for simultanuous occurence of the i-th and j-th L-word, where word j is a word that follows word i overlapping. Thus, the two words share the same L-1 symbols. |
| pi, pL,i→j | Conditional probability for the occurence of the j-th L-word, if the i-th L-word has been observed before |
While investigating the transmission of messages in telephone lines,
Shannon (1948)
defined the historically first measure of information - the Shannon Entropie:
 |
(1) |
The Shannon entropy increases linearly with increasing word length. Normalization with the word length yields the same notion of information, but independently of the word length. This measure is called Metric Entropy:
 |
(2) |
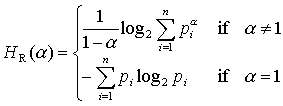
Rényi (1960 u. 1961) proposed a generalization of the Shannon entropy - the Rényi Entropy of the order α:
 |
(3) |
The knowledge of a symbol that follows an L-word contributes to the local information. The average gain of information leads to the definition of another important measure of information: The mean information gain.
 |
(4) |
 |
(5) |
The mean mutual information measures how much information is in the dependency (correlation) of two successive words. It is defined after Wackerbauer et al. (1994) as:
 |
(6) |
 |
(7) |
The minimum total amount of information that has to be stored at any time for an optimal prediction of the next symbol is measured after Grassberger (1986, S. 920) by the Effective Measure Complexity. This measure is defined as a limit value and can be approximated by the formula
 |
(8) |
 |
(9) |
While shifting from L-word i to L-word j the newly observed symbol contributes to a gain of information. This lead to the definition of the mean information gain. At the same time there is a loss of information, because we forget the first symbol of word i. In average for the whole symbol sequence, information gain and loss eliminate each other. The fluctuation between these two values is measured by the fluctuation complexity after Bates & Shepard (1993).
 |
(10) |
According to an oral recommendation of Prof. Dr. Jürgen Kurths a measure of complexity can be defined by regarding the differences of Rényi entropies of conjugated orders. This leads to an own definition of a measure of complexity. Let the Rényi Complexity CR(α) of the order α > 1 of a distribution of L-words be:
 |
(11) |
 |
(12) |
As already mentioned in the notation section, measures of information and complexity are defined on probability distributions (of the L-words). But, these are unknown for practical data and have to be estimated from the relative frequencies. Obviously, these estimates may be impossible for large word lengths compared to the available amount of data. This leads to huge errors in the measures. For N data points there are N−L+1 words. Theoretially there are a maximum of λL different words. Thus, not all theoretically possible words may be observable (sufficiently frequent) even if the word length is comparable small. Unfortunately, the description of the dynamic data structure usually requires higher word lengths. This fixes the word length to the maximum size that still allows a sufficient precise calculation of a measure.
Such a value cannot be determined for all possible distributions of words. But an estimate for the worst case is possible. This is the case of equally distributed random sequences, because here all words are possible and the data stock is exhausted at first compared to other distributions. In that case the probability to observe a word one time, two times, three times etc. follows a binomial distribution. So, for each measure of information or complexity an expected value depending on the amount of data, word length and alphabet size can be calculated. The respecitve formula have been extracted in the thesis. The theoretical value of the measures in this case is also known. Thus, a condition of tolerance for the deviation (relative precision) of the expected value compared to the theoretical value can be stated. For a given maximum relative error (minimum precision) the required amount of data can be determined for each alphabet size and word length. This requires immense computation resources, because the unequations cannot be solved analytically. Such calculations have been performed within the thesis for some relevant parameter combinations. I. e. for 1 % and 2 % relative precision, binary, ternary and quaternary alphabets and all word lengths until more than 1000000 data points become required. The results are presented here with help of the JavaScript calculator.
The JavaScript calculator helps you to find out, which word length is possible for a given amount of data, or which data amount is required for a given word length. The calculator considers the worst (most data consuming) case. Therefore you should be aware of the following:
The measures in the calculator refer to the following formula: Shannon entropy: (1), (2) and (3) with α ≈ 1; Information gain: (4) and (5); Mutual information: diff. (7), comp. (6); Effective measure complexity: (8) and (9); Fluctuation complexity: (10); Rényi complexity: (11) with α = 1.0001.
| Last change: June, 10th 2001 | Accesses since February, 21th 2001: |